SGS Market Timer Status: SHORT
SHORT as of the close of Friday March 25, 2022
Previous SGS Status
SGS is a Long-Term (weeks to months) Timer
Why Market Timing Is A Must
SGS Market Timer
As of the close of last Friday (3/25), the value of SGS was calculated to be -138 and the status of SGS changed from NEUTRAL to SHORT. That is a disappointing number for bulls. It indicates that indices are pushed higher via big caps while the broader market having a hard time catching up. I think there is a good chance that we see a small sell-off next week before heading higher.
S&P 500 Support And Resistance Levels
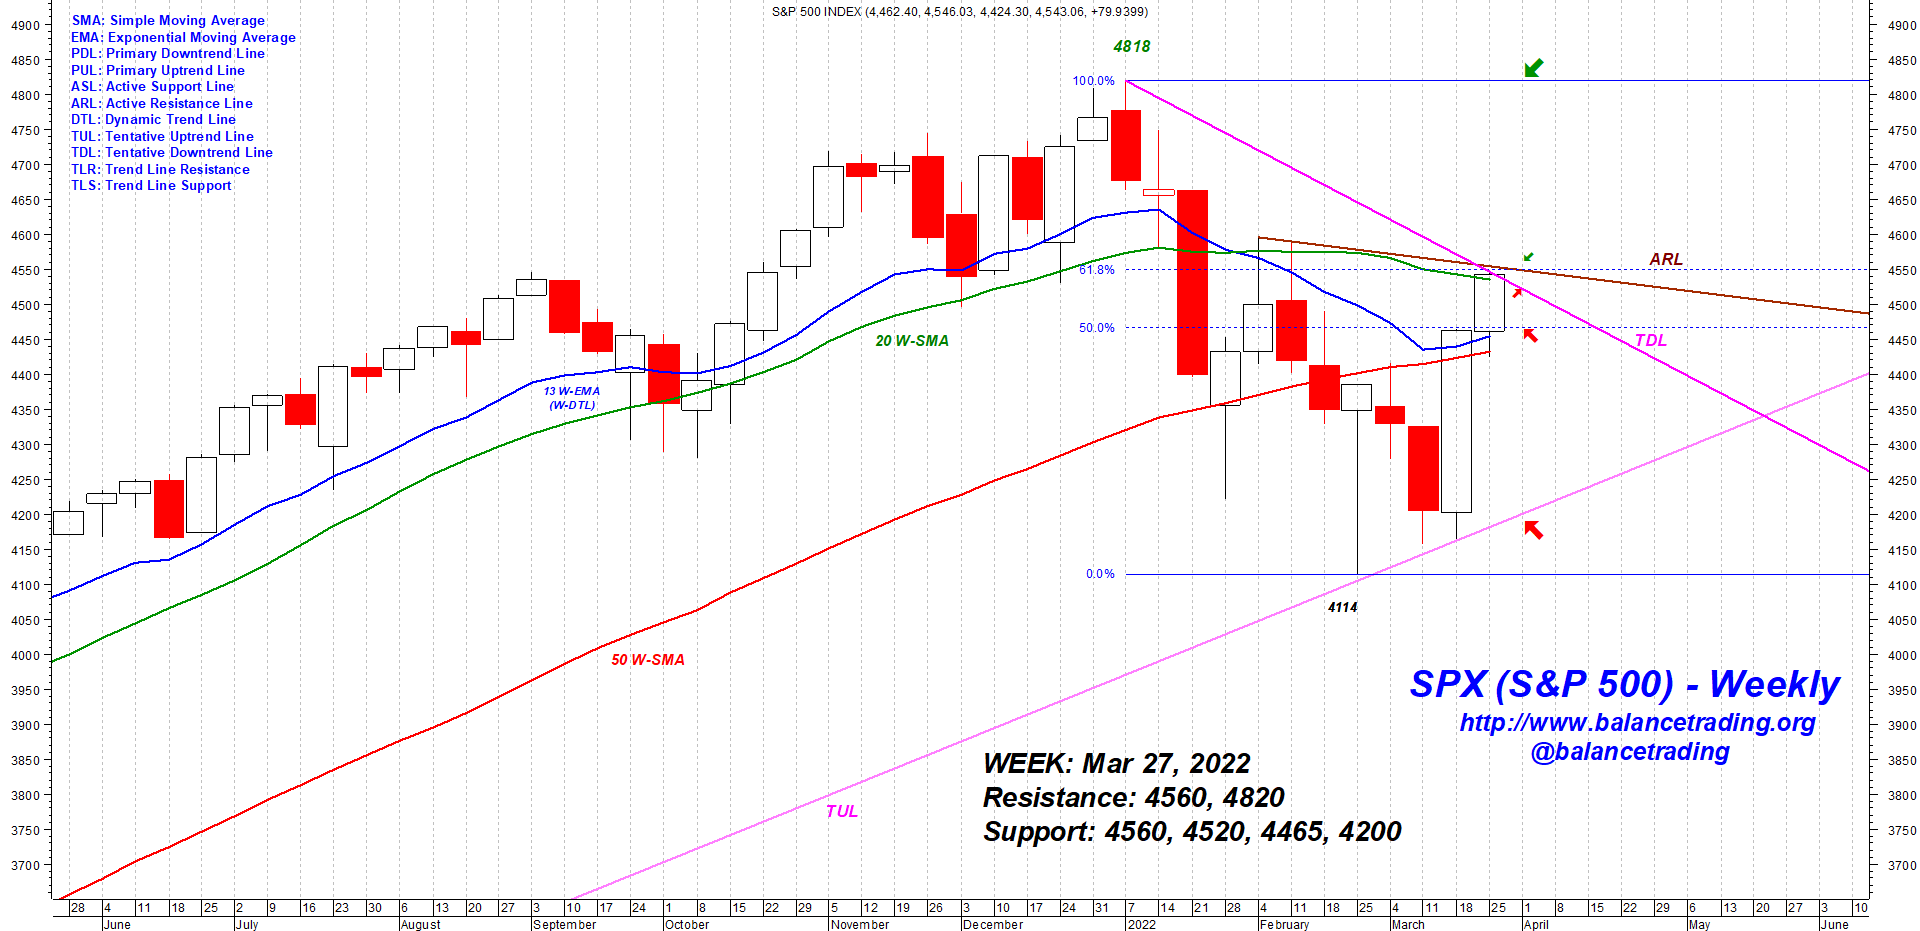
My Plan
The value of SGS didn't go above +50 last week. I am 95% in cash and watching from the sideline.
SPX: S&P 500 Index SMA: Simple Moving Average
DJI: Dow Jones Industrial Index EMA: Exponential Moving Average
DJT: Dow Jones Transportation Index PDL: Primary Downtrend Line
NAZ: NASDAQ Composite Index PUL: Primary Uptrend Line
RUT: Russell 2000 Index ASL: Active Support Line
OEX: S&P 100 Index ARL: Active Resistance Line
NDX: NASDAQ 100 Index DTL: Dynamic Trend Line
TUL: Tentative Uptrend Line TDL: Tentative Downtrend Line
TLR: Trend Line Resistance TLS: Trend Line Support
Disclaimer: The views expressed are provided for informational purposes only and should not be construed in any way as investment advice or recommendation. Furthermore, the opinions expressed may change without notice.


