SGS Market Timer Status: SHORT
SHORT as of the close of Friday January 7, 2022
Previous SGS Status
SGS is a Long-Term (weeks to months) Timer
Why Market Timing Is A Must
SGS Market Timer
As of the close of last Friday (1/28), the value of SGS was calculated to be -1870 and the status of SGS remains SHORT. Last Monday, SGS put in a value of -2821 and signaled that the bottom for the current correction was very likely in. For the next following three days, the value of SGS increased but on Friday it dropped to -1870 despite a strong rally. That was disappointing and signaled that SPX could sell off again to test last Monday's low (4222) sometime this week.
S&P 500 Support And Resistance Levels

Support and resistance levels for SPX for this week are shown above. SPX is still trading below its PUL-2 and that is bearish.
My Plan
My target of SPX 4225 for the correction was reached last Monday and I closed my short position. Except for two small crypto positions, I am in cash for now.
SPX: S&P 500 Index SMA: Simple Moving Average
DJI: Dow Jones Industrial Index EMA: Exponential Moving Average
DJT: Dow Jones Transportation Index PDL: Primary Downtrend Line
NAZ: NASDAQ Composite Index PUL: Primary Uptrend Line
RUT: Russell 2000 Index ASL: Active Support Line
OEX: S&P 100 Index ARL: Active Resistance Line
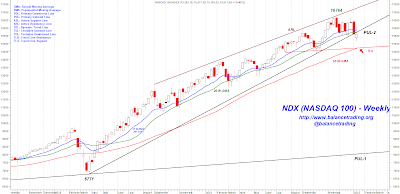
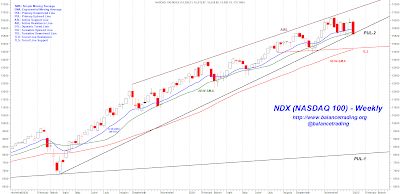
NDX: NASDAQ 100 Index DTL: Dynamic Trend Line
TUL: Tentative Uptrend Line TDL: Tentative Downtrend Line
DJI: Dow Jones Industrial Index EMA: Exponential Moving Average
DJT: Dow Jones Transportation Index PDL: Primary Downtrend Line
NAZ: NASDAQ Composite Index PUL: Primary Uptrend Line
RUT: Russell 2000 Index ASL: Active Support Line
OEX: S&P 100 Index ARL: Active Resistance Line
NDX: NASDAQ 100 Index DTL: Dynamic Trend Line
TUL: Tentative Uptrend Line TDL: Tentative Downtrend Line
TLR: Trend Line Resistance TLS: Trend Line Support
Disclaimer: The views expressed are provided for informational purposes only and should not be construed in any way as investment advice or recommendation. Furthermore, the opinions expressed may change without notice.