Sunday, December 26, 2021

SGS Market Timer Is NEUTRAL

SGS  Market Timer Status:  NEUTRAL 
NEUTRAL as of the close of Thursday December 23, 2021
Previous SGS Status
SGS is a Long-Term (weeks to months) Timer
Why Market Timing Is A Must


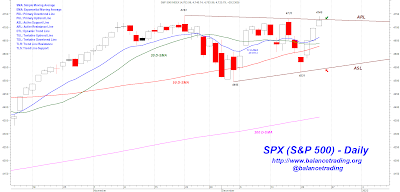
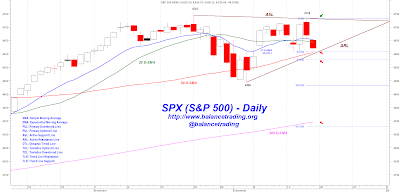
Last Thursday, SPX closed at a new all-time closing high, bullish.  It also tested its ARL overhead but failed to close above it, bearish.  This week SPX could continue to go higher to new all-time highs and beyond.  It could also sell off to test is ASL.  It's 50/50.


SGS Market Timer

As of the close of last Thursday (12/23), the value of SGS was calculated to be -13 and the status of SGS changed from SHORT to NEUTRAL.


S&P 500 Support And Resistance Levels

Support and resistance levels for SPX for next week are shown above.  


My Plan

With SGS being NEUTRAL, my plan is to close my short EFT positions sometime this week.


Merry Christmas & Happy Holidays


twitter
opader@gmail.com


SPX: S&P 500 Index    SMA: Simple Moving Average
DJI: Dow Jones Industrial Index    EMA: Exponential Moving Average
DJT: Dow Jones Transportation Index    PDL: Primary Downtrend Line
NAZ: NASDAQ Composite Index    PUL: Primary Uptrend Line
RUT: Russell 2000 Index    ASL: Active Support Line
OEX: S&P 100 Index    ARL: Active Resistance Line
NDX: NASDAQ 100 Index    DTL: Dynamic Trend Line   
TUL: Tentative Uptrend Line   TDL: Tentative Downtrend Line
TLR: Trend Line Resistance   TLS: Trend Line Support

Disclaimer: The views expressed are provided for informational purposes only and should not be construed in any way as investment advice or recommendation.  Furthermore, the opinions expressed may change without notice.  

Sunday, December 19, 2021

If 50 Goes, Next Would Be 200

SGS  Market Timer Status:  SHORT 
SHORT as of the close of Friday November 19, 2021
Previous SGS Status
SGS is a Long-Term (weeks to months) Timer
Why Market Timing Is A Must


Last Friday, SPX tested its 50 D-SMA on its daily chart, shown above, and 50 D-SMA held.  There is a good chance; however, that 50 D-SMA gets tested again on Monday.  Should 50 D-SMA fail and SPX closes below it, then there would be an excellent chance that selling continues for the next couple of weeks as SPX moves to test its 200 D-SMA around 4300.  4300 is around 10% lower than SPX all-time high of 4743.  Based on what has happened in previous corrections since 2009, a 10% correction is when alarms start to ring at the Federal Reserve.


SGS Market Timer

As of the close of last Friday (12/17), the value of SGS was calculated to be -550 and the status of SGS remains SHORT.


S&P 500 Support And Resistance Levels

Support and resistance levels for SPX for next week are shown above.  


My Plan

I'm in cash except for two small crypto positions.  Should SPX close below its 50 D-SMA on its daily chart, I would open new positions in SPXS, TZA, and SQQQ (10% of total capital each).


twitter
opader@gmail.com


SPX: S&P 500 Index    SMA: Simple Moving Average
DJI: Dow Jones Industrial Index    EMA: Exponential Moving Average
DJT: Dow Jones Transportation Index    PDL: Primary Downtrend Line
NAZ: NASDAQ Composite Index    PUL: Primary Uptrend Line
RUT: Russell 2000 Index    ASL: Active Support Line
OEX: S&P 100 Index    ARL: Active Resistance Line
NDX: NASDAQ 100 Index    DTL: Dynamic Trend Line   
TUL: Tentative Uptrend Line   TDL: Tentative Downtrend Line
TLR: Trend Line Resistance   TLS: Trend Line Support

Disclaimer: The views expressed are provided for informational purposes only and should not be construed in any way as investment advice or recommendation.  Furthermore, the opinions expressed may change without notice. 

Sunday, December 12, 2021

Recent Lows Are Very Likely Tested Soon

SGS  Market Timer Status:  SHORT 
SHORT as of the close of Friday November 19, 2021
Previous SGS Status
SGS is a Long-Term (weeks to months) Timer
Why Market Timing Is A Must


Last Friday, SPX closed at a new all-time closing high while other major indices closed at lower highs.  That "bearish divergence" by other major indices was especially pronounced in case of RUT, which in itself is even more bearish, signaling that the rally since early December lows is not sustainable.  At this point, there is a good chance that Friday December 3 lows are tested this week and very likely fail.


SGS Market Timer

As of the close of last Friday (12/10), the value of SGS was calculated to be -132 and the status of SGS remains SHORT.


S&P 500 Support And Resistance Levels

Support and resistance levels for SPX for next week are shown above.  


My Plan

Per my plan I closed my long positions last Monday.  For now, I'm staying in cash except for two small crypto positions. 


twitter
opader@gmail.com


SPX: S&P 500 Index    SMA: Simple Moving Average
DJI: Dow Jones Industrial Index    EMA: Exponential Moving Average
DJT: Dow Jones Transportation Index    PDL: Primary Downtrend Line
NAZ: NASDAQ Composite Index    PUL: Primary Uptrend Line
RUT: Russell 2000 Index    ASL: Active Support Line
OEX: S&P 100 Index    ARL: Active Resistance Line
NDX: NASDAQ 100 Index    DTL: Dynamic Trend Line   
TUL: Tentative Uptrend Line   TDL: Tentative Downtrend Line
TLR: Trend Line Resistance   TLS: Trend Line Support

Disclaimer: The views expressed are provided for informational purposes only and should not be construed in any way as investment advice or recommendation.  Furthermore, the opinions expressed may change without notice. 

Sunday, December 5, 2021

It's Not The Virus, It's The Fed

SGS  Market Timer Status:  SHORT 
SHORT as of the close of Friday November 19, 2021
Previous SGS Status
SGS is a Long-Term (weeks to months) Timer
Why Market Timing Is A Must


The new Coronavirus variant, Omicron, is "highly" contagious but early data indicates that vaccinated individuals who were infected show mild symptoms and recover quickly.  More people are now choosing to get vaccinated and that is bullish because chances of an economic shutdown substantially diminishes as more people are vaccinated. 

Selling due to Omicron was done on Fri 11/26, but a  new wave of selling started as Powell came in super hawkish before the congress last Wednesday and another regional president doubled down on his hawkishness last Friday.  Selling very likely continues until the Fed signals a more dovish plan on tapering, quantitative tightening, and the Fed Funds Rate.  In the past, those dovish signals didn't come in until indices had corrected at least 20% from their highs. 


SGS Market Timer

As of the close of last Friday (12/3), the value of SGS was calculated to be -987 and the status of SGS remains SHORT.


S&P 500 Support And Resistance Levels

Support and resistance levels for SPX for next week are shown above.  Last week SPX successfully tested its PUL-2 last Friday, a close below that line would signal significant selling ahead.


My Plan

In light of the new hawkish stand of the Fed, I believe selling continues.  My plan is to close my long positions (except two small crypto positions) sometime this week.


twitter
opader@gmail.com


SPX: S&P 500 Index    SMA: Simple Moving Average
DJI: Dow Jones Industrial Index    EMA: Exponential Moving Average
DJT: Dow Jones Transportation Index    PDL: Primary Downtrend Line
NAZ: NASDAQ Composite Index    PUL: Primary Uptrend Line
RUT: Russell 2000 Index    ASL: Active Support Line
OEX: S&P 100 Index    ARL: Active Resistance Line
NDX: NASDAQ 100 Index    DTL: Dynamic Trend Line   
TUL: Tentative Uptrend Line   TDL: Tentative Downtrend Line
TLR: Trend Line Resistance   TLS: Trend Line Support

Disclaimer: The views expressed are provided for informational purposes only and should not be construed in any way as investment advice or recommendation.  Furthermore, the opinions expressed may change without notice.  

Sunday, November 28, 2021

Omicron Sell-off Is A Buying Opportunity

SGS  Market Timer Status:  SHORT 
SHORT as of the close of Friday November 19, 2021
Previous SGS Status
SGS is a Long-Term (weeks to months) Timer
Why Market Timing Is A Must


Panic selling last Friday was a buying opportunity. Chances are good that selling continues early this week, offering more buying opportunities. 


SGS Market Timer

As of the close of last Friday (11/26), the value of SGS was calculated to be -572 and the status of SGS remains SHORT.


S&P 500 Support And Resistance Levels

Support and resistance levels for SPX for next week are shown above.


My Plan

SGS is short and in hindsight, I should have closed my long positions last Monday as I had planed. I think at this point selling is either done or close to it.


twitter
opader@gmail.com


SPX: S&P 500 Index    SMA: Simple Moving Average
DJI: Dow Jones Industrial Index    EMA: Exponential Moving Average
DJT: Dow Jones Transportation Index    PDL: Primary Downtrend Line
NAZ: NASDAQ Composite Index    PUL: Primary Uptrend Line
RUT: Russell 2000 Index    ASL: Active Support Line
OEX: S&P 100 Index    ARL: Active Resistance Line
NDX: NASDAQ 100 Index    DTL: Dynamic Trend Line   
TUL: Tentative Uptrend Line   TDL: Tentative Downtrend Line
TLR: Trend Line Resistance   TLS: Trend Line Support

Disclaimer: The views expressed are provided for informational purposes only and should not be construed in any way as investment advice or recommendation.  Furthermore, the opinions expressed may change without notice. 

Sunday, November 21, 2021

SGS Market Timer Is SHORT

SGS  Market Timer Status:  SHORT 
SHORT as of the close of Friday November 19, 2021
Previous SGS Status
SGS is a Long-Term (weeks to months) Timer
Why Market Timing Is A Must


SGS Market Timer

As of the close of last Friday (11/19), the value of SGS was calculated to be -166 and the status of SGS changed from LONG to SHORT.


S&P 500 Support And Resistance Levels

Support and resistance levels for SPX for next week are shown above.


My Plan

With SGS being SHORT, I'm planning to close my long positions except for two cryptos.


twitter
opader@gmail.com


SPX: S&P 500 Index    SMA: Simple Moving Average
DJI: Dow Jones Industrial Index    EMA: Exponential Moving Average
DJT: Dow Jones Transportation Index    PDL: Primary Downtrend Line
NAZ: NASDAQ Composite Index    PUL: Primary Uptrend Line
RUT: Russell 2000 Index    ASL: Active Support Line
OEX: S&P 100 Index    ARL: Active Resistance Line
NDX: NASDAQ 100 Index    DTL: Dynamic Trend Line   
TUL: Tentative Uptrend Line   TDL: Tentative Downtrend Line
TLR: Trend Line Resistance   TLS: Trend Line Support

Disclaimer: The views expressed are provided for informational purposes only and should not be construed in any way as investment advice or recommendation.  Furthermore, the opinions expressed may change without notice.  

Sunday, November 14, 2021

Bulls Are In Control - Rally Continues

SGS  Market Timer Status:  LONG 
LONG as of the close of Friday October 15, 2021
Previous SGS Status
SGS is a Long-Term (weeks to months) Timer
Why Market Timing Is A Must


SGS Market Timer

As of the close of last Friday (11/12), the value of SGS was calculated to be +232 and the status of SGS remains LONG.


S&P 500 Support And Resistance Levels

Support and resistance levels for SPX for next week are shown above.


My Plan

I am 100% in and planning to stay with my long positions in my portfolio.


twitter
opader@gmail.com


SPX: S&P 500 Index    SMA: Simple Moving Average
DJI: Dow Jones Industrial Index    EMA: Exponential Moving Average
DJT: Dow Jones Transportation Index    PDL: Primary Downtrend Line
NAZ: NASDAQ Composite Index    PUL: Primary Uptrend Line
RUT: Russell 2000 Index    ASL: Active Support Line
OEX: S&P 100 Index    ARL: Active Resistance Line
NDX: NASDAQ 100 Index    DTL: Dynamic Trend Line   
TUL: Tentative Uptrend Line   TDL: Tentative Downtrend Line
TLR: Trend Line Resistance   TLS: Trend Line Support

Disclaimer: The views expressed are provided for informational purposes only and should not be construed in any way as investment advice or recommendation.  Furthermore, the opinions expressed may change without notice. 

Sunday, November 7, 2021

Indices Look Good

SGS  Market Timer Status:  LONG 
LONG as of the close of Friday October 15, 2021
Previous SGS Status
SGS is a Long-Term (weeks to months) Timer
Why Market Timing Is A Must


SGS Market Timer

As of the close of last Friday (11/5), the value of SGS was calculated to be +436 and the status of SGS remains LONG.


S&P 500 Support And Resistance Levels

Support and resistance levels for SPX for next week are shown above.
twitter
opader@gmail.com


SPX: S&P 500 Index    SMA: Simple Moving Average
DJI: Dow Jones Industrial Index    EMA: Exponential Moving Average
DJT: Dow Jones Transportation Index    PDL: Primary Downtrend Line
NAZ: NASDAQ Composite Index    PUL: Primary Uptrend Line
RUT: Russell 2000 Index    ASL: Active Support Line
OEX: S&P 100 Index    ARL: Active Resistance Line
NDX: NASDAQ 100 Index    DTL: Dynamic Trend Line   
TUL: Tentative Uptrend Line   TDL: Tentative Downtrend Line
TLR: Trend Line Resistance   TLS: Trend Line Support

Disclaimer: The views expressed are provided for informational purposes only and should not be construed in any way as investment advice or recommendation.  Furthermore, the opinions expressed may change without notice.   

Sunday, October 31, 2021

Rally Continues

SGS  Market Timer Status:  LONG 
LONG as of the close of Friday October 15, 2021
Previous SGS Status
SGS is a Long-Term (weeks to months) Timer
Why Market Timing Is A Must


Major indices, expect for RUT, reached fresh new all-time highs last week.  That is bullish and signals higher prices for major indices between now and the end of the year.  Sometime in early November, the Fed is to announce its "taper" plan.  There is a good chance that the Fed announces a super dovish plan which could push indices much higher in a strong Christmas rally.


SGS Market Timer

As of the close of last Friday (10/29), the value of SGS was calculated to be +248 and the status of SGS remains LONG.


S&P 500 Support And Resistance Levels


Support and resistance levels for SPX for next week are shown above.
twitter
opader@gmail.com


SPX: S&P 500 Index    SMA: Simple Moving Average
DJI: Dow Jones Industrial Index    EMA: Exponential Moving Average
DJT: Dow Jones Transportation Index    PDL: Primary Downtrend Line
NAZ: NASDAQ Composite Index    PUL: Primary Uptrend Line
RUT: Russell 2000 Index    ASL: Active Support Line
OEX: S&P 100 Index    ARL: Active Resistance Line
NDX: NASDAQ 100 Index    DTL: Dynamic Trend Line   
TUL: Tentative Uptrend Line   TDL: Tentative Downtrend Line
TLR: Trend Line Resistance   TLS: Trend Line Support

Disclaimer: The views expressed are provided for informational purposes only and should not be construed in any way as investment advice or recommendation.  Furthermore, the opinions expressed may change without notice.  

Sunday, October 24, 2021

Indices Look Good

SGS  Market Timer Status:  LONG 
LONG as of the close of Friday October 15, 2021
Previous SGS Status
SGS is a Long-Term (weeks to months) Timer
Why Market Timing Is A Must


Generally speaking, earnings reports have been solid and stocks of companies with good reports have gone up.  That is bullish and signals higher prices for major indices between now and end of this year.  Sometime next month, the Fed is to announce their "taper" plan.  There is a good chance that the Fed announces a super dovish plan which could push indices higher in a strong Christmas rally.


SGS Market Timer

As of the close of last Friday (10/22), the value of SGS was calculated to be +300 and the status of SGS remains LONG.


S&P 500 Support And Resistance Levels

Support and resistance levels for SPX for next week are shown above.


My Plan

Per my plan, I opened new long positions in QQQ and SPY last Thursday.  I am now 100% in.


twitter
opader@gmail.com


SPX: S&P 500 Index    SMA: Simple Moving Average
DJI: Dow Jones Industrial Index    EMA: Exponential Moving Average
DJT: Dow Jones Transportation Index    PDL: Primary Downtrend Line
NAZ: NASDAQ Composite Index    PUL: Primary Uptrend Line
RUT: Russell 2000 Index    ASL: Active Support Line
OEX: S&P 100 Index    ARL: Active Resistance Line
NDX: NASDAQ 100 Index    DTL: Dynamic Trend Line   
TUL: Tentative Uptrend Line   TDL: Tentative Downtrend Line
TLR: Trend Line Resistance   TLS: Trend Line Support

Disclaimer: The views expressed are provided for informational purposes only and should not be construed in any way as investment advice or recommendation.  Furthermore, the opinions expressed may change without notice.  

Sunday, October 17, 2021

Earnings Will Make Or Break Indices

SGS  Market Timer Status:  LONG 
LONG as of the close of Friday October 15, 2021
Previous SGS Status
SGS is a Long-Term (weeks to months) Timer
Why Market Timing Is A Must


A number of companies are reporting earnings this week.  If their stocks sell off significantly despite good earnings,  that would be a giant red flag for indices, especially NDX.


SGS Market Timer

As of the close of last Friday (10/15), the value of SGS was calculated to be +324 and the status of SGS changed from NEUTRAL to LONG.


S&P 500 Support And Resistance Levels


Support and resistance levels for SPX for next week are shown above.


My Plan

Per my plan, I opened new long positions in XLF, XLE, XLB, and XLI last Monday.  On Friday, I also open a new long position in IWM.

I have 10% remaining in cash and for now I am going to watch earnings and see how indices react to them.


twitter
opader@gmail.com


SPX: S&P 500 Index    SMA: Simple Moving Average
DJI: Dow Jones Industrial Index    EMA: Exponential Moving Average
DJT: Dow Jones Transportation Index    PDL: Primary Downtrend Line
NAZ: NASDAQ Composite Index    PUL: Primary Uptrend Line
RUT: Russell 2000 Index    ASL: Active Support Line
OEX: S&P 100 Index    ARL: Active Resistance Line
NDX: NASDAQ 100 Index    DTL: Dynamic Trend Line   
TUL: Tentative Uptrend Line   TDL: Tentative Downtrend Line
TLR: Trend Line Resistance   TLS: Trend Line Support

Disclaimer: The views expressed are provided for informational purposes only and should not be construed in any way as investment advice or recommendation.  Furthermore, the opinions expressed may change without notice.  

Sunday, October 10, 2021

Selling Is Very Likely Done

SGS  Market Timer Status:  NEUTRAL 
NEUTRAL as of the close of Friday October 08, 2021
Previous SGS Status
SGS is a Long-Term (weeks to months) Timer
Why Market Timing Is A Must


SGS Market Timer

As of the close of last Friday (10/8), the value of SGS was calculated to be +42 and the status of SGS changed from SHORT to NEUTRAL.


S&P 500 Support And Resistance Levels


Support and resistance levels for SPX for next week are shown above.


My Plan

I didn't open any short positions last week.  My plan is to open long positions in SPY (15%), QQQ (15%), IWM (15%), XLE (25%), and XLF (25%) sometime early this week.


twitter
opader@gmail.com


SPX: S&P 500 Index    SMA: Simple Moving Average
DJI: Dow Jones Industrial Index    EMA: Exponential Moving Average
DJT: Dow Jones Transportation Index    PDL: Primary Downtrend Line
NAZ: NASDAQ Composite Index    PUL: Primary Uptrend Line
RUT: Russell 2000 Index    ASL: Active Support Line
OEX: S&P 100 Index    ARL: Active Resistance Line
NDX: NASDAQ 100 Index    DTL: Dynamic Trend Line   
TUL: Tentative Uptrend Line   TDL: Tentative Downtrend Line
TLR: Trend Line Resistance   TLS: Trend Line Support

Disclaimer: The views expressed are provided for informational purposes only and should not be construed in any way as investment advice or recommendation.  Furthermore, the opinions expressed may change without notice.