Sunday, December 30, 2012

SPX Is About To Test Its 200 D-SMA

Long Term Current and Past Portfolios

New Long Term Dividend Portfolios

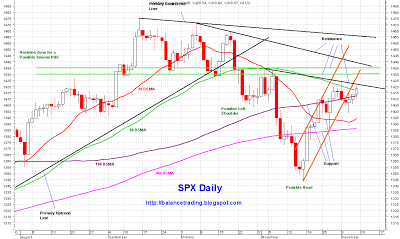
Last week SPX broke out of it down trending price channel (thick black) and started trading in a much steeper channel (thick orange).  At this point chances are very good that SPX tests its 200 D-SMA around 1390 sometime this coming week, possibly tomorrow if no agreement is reached to avert "Fiscal Cliff".   A close below 200 D-SMA would be extremely negative and would signal much more selling.  My plan at this point is to exist my long positions.  I think we are in for a nasty fight between Dems and Reps that will go on and on for a while, a long while.

Face Book

Disclaimer: The views expressed are provided for information purposes only and should not be construed in any way as investment advice or recommendation.  Furthermore, the opinions expressed may change without notice.

Sunday, December 23, 2012

An Agreement On "Fiscal Cliff" In 2012 Is Not Likely

Long Term Current and Past Portfolios

New Long Term Dividend Portfolios


After rallying on Monday and Tuesday, SPX sold off and formed a new down trending price channel (orange).  SPX very likely would continue trading in that channel so long as there is no resolution to the budget negotiation in DC.  Chances of Reps and Dems reaching an agreement before Dec 31 deadline is not good imo.  

Possible outcomes are:
  • (A) An agreement reached and "FC" avoided (30%): Short term (hours to days), indices would rally initially on the back of short covering.  I have no idea what happens in the medium term (days to weeks), but long term (weeks to months) I believe indices would rally and put in all time highs.

  • (B) No agreement by EOY (70%):  Short term selling would accelerate significantly (5% to 7%) due to "tax selling" and general uncertainty.  Out look for the medium term would also be very bleak because once the Dec 31 deadline passes, the negotiation over cuts in spending and taxes would be dragged on for weeks if not months.  Long term, however, I believe indices would eventually rally and put in all time highs once an agreement is reached.
Last week, per my plan I did my first of four in both RTS and RTS-Div Portfolios.  My plan is to see if an agreement is reached next week and at that point do another buy.  Otherwise, I am going to wait to do more buys in early 2013.

Face Book

Disclaimer: The views expressed are provided for information purposes only and should not be construed in any way as investment advice or recommendation.  Furthermore, the opinions expressed may change without notice.

Thursday, December 20, 2012

SPX Is Backteing Neckline

Long Term Current and Past Portfolios

New Long Term Dividend Portfolios


On Tuesday SPX rallied and closed solidly above the neckline (SPX 1435, thick green) of an inverse head and shoulder price formation.  The confirmation of that pattern signals a move to its objective (SPX 1525) by mid January. 

As expected, SPX sold off yesterday to back test the neckline.  Assuming a successful back test (i.e. a close above the neckline today), my plan is to do my first buy of four sometime today.  There is a good chance that SPX sells off to back test trend line supports at 1431 and 1424 today.

Below is my list of picks (with some changes since I posted them initially on Monday):

RTS Portfolio:  
FSLR  GMCR  KBH  PHM  PXP  NFLX   MPEL  NRG  C VLO WDC ETN

RTS Dividend Portfolio: 
SFUN  NCT  NRF  SCCO  ATAX   PMT   CLMT   RAS  RBS   WSR  MITT  KCAP  HIG

Face Book

Disclaimer: The views expressed are provided for information purposes only and should not be construed in any way as investment advice or recommendation.  Furthermore, the opinions expressed may change without notice.

Monday, December 17, 2012

Back Testing Of SMA's Is Likely

Long Term Current and Past Portfolios

New Long Term Dividend Portfolios


Cash indices rallied today due to buying and short covering of their futures.  SPX is about to run into a major resistance zone (1431 - 1435) which very likely sends SPX down to back test its 100, 50 and possibly 20 D-SMA (1417 - 1411) within next couple of days. My plan is to open new long positions (1st of 4 buys) in that sell off.  There is also the possibility of SPX continuing its rally and pushing through the neckline.  In that case, I would open long positions as it sells off to back test the neckline at or around 1436.

RTS Picks:  
FSLR  GMCR  KBH  PHM  PXP  NFLX   MPEL  NRG  C VLO

RTS Dividend: 
SFUN  NCT  NRF  SCCO  ATAX   PMT   CLMT   RAS  RBS   WSR

Face Book

Disclaimer: The views expressed are provided for information purposes only and should not be construed in any way as investment advice or recommendation.  Furthermore, the opinions expressed may change without notice.

Market Is Predicting A Budget Agreement

Long Term Current and Past Portfolios

New Long Term Dividend Portfolios


Despite selling in indices last week, market breadth and number of new highs actually improved signaling that any future selling in indices would be limited.  Also, selling last week put in the right shoulder of a possible inverse H&S price formation for most major indices.  

I except a very choppy trading week ahead, but chances are good now that indices eventually rally later in the week.  That means Market is predicting that a budget agreement will be reached by end of his coming week or at least significant progress is made toward an agreement.

Per my plan all long positions both in RTS and RTS dividend long term portfolios were closed last week.  My plan is to buy dips and open new long positions in both long term portfolios starting this week.  I will post my picks tomorrow.

Face Book

Disclaimer: The views expressed are provided for information purposes only and should not be construed in any way as investment advice or recommendation.  Furthermore, the opinions expressed may change without notice.

Sunday, December 9, 2012

Uptrend Is In Trouble

Long Term Current and Past Portfolios


The rally that started on 11/16 is running to stiff resistance.  On weekly charts, except for NAZ, the uptrend in all major indices is still intact.  For daily charts, it is a different story.  Except for DJI, the uptrend in all major indices has been broken.

Indices are predicting a drawn out budget fight in DC. A fight that is not going to be settled until Big Money scares everyone into an agreement by pushing indices down 3% to 5% for a couple of days or so.  Those down days would be excellent buying opportunities.

My plan is to close all my long positions in both long term portfolios (RTS and RTS Div) and open new long positions during upcoming sell off.  I think SPX 1425 to 1435 is a good range to sell into.

Face Book

Disclaimer: The views expressed are provided for information purposes only and should not be construed in any way as investment advice or recommendation.  Furthermore, the opinions expressed may change without notice.
Site Meter

Tuesday, December 4, 2012

In RTS Divident Portfolio: Selling CXS and Buying SCCO

SGS is Long (As of close of 4/30/2012) 

Long Term Current and Past Portfolios
In RTS Portfolio, RTS is selling GPS and buying GMCR in its place tomorrow (Wed) at the open.

New Long Term Dividend Portfolios
In the new RTS Dividend Portfolio, RTS is selling CXS and buying SCCO in its place tomorrow (Wed) at the open.

The rally that started on 11/16 is still intact.  I still expect new post 08/09 crash highs for all major indices sometime this year assuming the worthless in DC reach a compromise and come up with a reasonable plan to raise revenue and cut spending.  I am not holding my breath, we could actually go over "the cliff" which would cause unprecedented chaos in all markets worldwide (an excellent buying opportunity, lol).

Face Book

Disclaimer: The views expressed are provided for information purposes only and should not be construed in any way as investment advice or recommendation.  Furthermore, the opinions expressed may change without notice.

Sunday, December 2, 2012

A Move To Test Neckline Is Very Likely

SGS is Long (As of close of 4/30/2012) 

SPX is trading within a rising price channel (shown in thick orange).  Chances are good that SPX continues its rally this coming week to 1430 - 1435 to test the Neckline of a possible Inv. H&S formation .  After that SPX could sell off to 1410 - 1400 to put in the Right Shoulder and then rallying pass the Neckline which would signal a melt up to lower 1500.

Face Book

Disclaimer: The views expressed are provided for information purposes only and should not be construed in any way as investment advice or recommendation.  Furthermore, the opinions expressed may change without notice.

Sunday, November 25, 2012

An All Time High For SPX In 2012?

SGS is Long (As of close of 4/30/2012) 

Indices rallied last week as Big Money aggressively bought the dip into SPX 1340's.  SPX seems to be forming an Inverse H&S with its Neckline around 1430 to 1435 (thick green).  There is a good chance that SPX rallies to the neckline this coming week and then selling off to 1410 - 1400 to form the right shoulder. After that a rally pass the neckline signals a move to lower 1500's and possibly a melt up to higher 1500's.

Face Book

Disclaimer: The views expressed are provided for information purposes only and should not be construed in any way as investment advice or recommendation.  Furthermore, the opinions expressed may change without notice.

Monday, November 19, 2012

Indices Are Oversold - Late Post

SGS is Long (As of close of 4/30/2012) 

i

Indices are rallying from an oversold condition today (Monday).  I think there is a good chance we see SPX test resistance at 1400 to 1410 level this week or early next week.

Face Book

Disclaimer: The views expressed are provided for information purposes only and should not be construed in any way as investment advice or recommendation.  Furthermore, the opinions expressed may change without notice.

Sunday, November 11, 2012

Indices Are Oversold, A Rally Is Imminent

SGS is Long (As of close of 4/30/2012) 

RTS is selling UNG and buying NFLX in its place on Monday 11/12/2012 at the open.


Indices were push down hard which forced weak long hands to fold.  At this point, indices are oversold and we should see a rally starting tomorrow.
 
Face Book

Disclaimer: The views expressed are provided for information purposes only and should not be construed in any way as investment advice or recommendation.  Furthermore, the opinions expressed may change without notice.