Sunday, February 26, 2023

The Big Worry

SGS Market Timer Status:  SHORT 
SHORT as of the close of Friday February 24, 2023 
Previous SGS Status

SGS is a Long-Term (weeks to months) Timer
SGS Performance Data (New)
Why Market Timing Is A Must


The big worry of financial markets, as it was on full display last week when both stocks and bonds sold off substantially, is that the current aggressive rate hike plan by the Fed will balloon the budget deficit. That in turn would force the US Treasury to sell more debt at higher and higher interest rates. In other words, as the Fed raises short-term rates and slows down economic activities, the budget deficit balloons causing longer term rates to go higher. Higher longer term rates (5 years or higher) would also add to the slowdown causing an even higher budget deficit. This cycle could repeat itself until the economy ends up in a deep and prolonged recession during which indices would go substantially lower.


SGS Market Timer

As of the close of last Friday (2/24), the value of SGS was calculated to be -93.  The status of SGS changed from LONG to SHORT.


S&P 500 Support And Resistance Levels

Support and resistance levels for SPX for this week are shown above.  SPX is oversold and chances of a sizable short-covering rally is high.


My Plan

Per my plan I did buy XLF (10%) and XLV (10%) last week.  With SGS being SHORT now, I'm watching the daily value of SGS this week to decide to if and when to sell my long positions and move into cash.


twitter
opader@gmail.com


SPX: S&P 500 Index    SMA: Simple Moving Average
DJI: Dow Jones Industrial Index    EMA: Exponential Moving Average
DJT: Dow Jones Transportation Index    PDL: Primary Downtrend Line
NAZ: NASDAQ Composite Index    PUL: Primary Uptrend Line
RUT: Russell 2000 Index    ASL: Active Support Line
OEX: S&P 100 Index    ARL: Active Resistance Line
NDX: NASDAQ 100 Index    DTL: Dynamic Trend Line   
TUL: Tentative Uptrend Line   TDL: Tentative Downtrend Line
TLR: Trend Line Resistance   TLS: Trend Line Support

Disclaimer: The views expressed are provided for informational purposes only and should not be construed in any way as investment advice or recommendation.  Furthermore, the opinions expressed may change without notice.              

Sunday, February 19, 2023

5% And %5

SGS Market Timer Status:  LONG 
LONG as of the close of Friday February 17, 2023 
Previous SGS Status

SGS is a Long-Term (weeks to months) Timer
SGS Performance Data (New)
Why Market Timing Is A Must


The only way the Fed could possibly bring inflation down to their target (2%) is to crush the economy and push unemployment rate to somewhere between 8% to 10%. So, are they going to do that? Not likely because raising the Fud funds rate beyond 6% and it keeping there even for a couple of quarters would balloon the budget deficit to over $1.5 trillion in 2024 and over $2.0 trillion in 2025.

Indices are very likely on a new bull leg and will continue going higher because there is a good chance now that the market has accepted the fact that an average inflation rate of 5% and average long-term interest rate of 5% are the new norm. The era of "free money", i.e. under 3% interest rates, is over.


SGS Market Timer

As of the close of last Friday (2/17), the value of SGS was calculated to be +71.  The status of SGS changed from NEUTRAL to LONG.


S&P 500 Support And Resistance Levels

Support and resistance levels for SPX for this week are shown above.  


My Plan

I didn't close any of my long positions last week. 
With SGS changing its status to LONG now, I'm planning to buy XLF (10%) and XLV (10%) sometime this week.


twitter
opader@gmail.com


SPX: S&P 500 Index    SMA: Simple Moving Average
DJI: Dow Jones Industrial Index    EMA: Exponential Moving Average
DJT: Dow Jones Transportation Index    PDL: Primary Downtrend Line
NAZ: NASDAQ Composite Index    PUL: Primary Uptrend Line
RUT: Russell 2000 Index    ASL: Active Support Line
OEX: S&P 100 Index    ARL: Active Resistance Line
NDX: NASDAQ 100 Index    DTL: Dynamic Trend Line   
TUL: Tentative Uptrend Line   TDL: Tentative Downtrend Line
TLR: Trend Line Resistance   TLS: Trend Line Support

Disclaimer: The views expressed are provided for informational purposes only and should not be construed in any way as investment advice or recommendation.  Furthermore, the opinions expressed may change without notice.             

Sunday, February 12, 2023

SGS Market Timer Is NEUTRAL

SGS Market Timer Status:  NEUTRAL 
NEUTRAL as of the close of Friday February 10, 2023 
Previous SGS Status

SGS is a Long-Term (weeks to months) Timer
SGS Performance Data (New)
Why Market Timing Is A Must


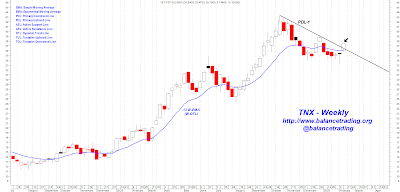
The recent selling of equity markets, especially NASDAQ, is due to the significant rise in interest rates, such as a 40 basis point (0.4%) rise in the 10-year Treasury note, in the last couple of weeks.

As shown on the chart above, the 10-year Treasury note yield breached its PDL-1 on its weekly chart and closed above it last Friday.  There is a good chance that 10-year Treasury yield continues to go higher and that would signal more selling is ahead for equities.


SGS Market Timer

As of the close of last Friday (2/10), the value of SGS was calculated to be +38.  The status of SGS changed from LONG to NEUTRAL.


S&P 500 Support And Resistance Levels

Support and resistance levels for SPX for this week are shown above.  


My Plan

With SGS changing its status to NEUTRAL, I'm planning to close my long positions, except for two small crypto positions, sometime this week.


twitter
opader@gmail.com


SPX: S&P 500 Index    SMA: Simple Moving Average
DJI: Dow Jones Industrial Index    EMA: Exponential Moving Average
DJT: Dow Jones Transportation Index    PDL: Primary Downtrend Line
NAZ: NASDAQ Composite Index    PUL: Primary Uptrend Line
RUT: Russell 2000 Index    ASL: Active Support Line
OEX: S&P 100 Index    ARL: Active Resistance Line
NDX: NASDAQ 100 Index    DTL: Dynamic Trend Line   
TUL: Tentative Uptrend Line   TDL: Tentative Downtrend Line
TLR: Trend Line Resistance   TLS: Trend Line Support

Disclaimer: The views expressed are provided for informational purposes only and should not be construed in any way as investment advice or recommendation.  Furthermore, the opinions expressed may change without notice.            
Saturday, February 4, 2023

SPX 5000 Sometime This Year?

SGS Market Timer Status:  LONG 
LONG as of the close of Friday January 6, 2023 
Previous SGS Status

SGS is a Long-Term (weeks to months) Timer
SGS Performance Data (New)
Why Market Timing Is A Must


With full employment and a strong economy, there is a good chance that we see SPX at 5000 or higher sometime this year.


SGS Market Timer

As of the close of last Friday (2/3), the value of SGS was calculated to be +267.  The status of SGS remains LONG.


S&P 500 Support And Resistance Levels

Support and resistance levels for SPX for this week are shown above.  SPX is above its PDL-1 and 50 W-SMA.  There is an excellent chance that sometime next week we see SPX trading above its 50% and 61.8% Fib. retracement of its decline from 4818 to 3491.


My Plan

Per my plan I opened new positions in SSO and XLY last Thursday.  I'm planning to open new long positions once there is a weekly close for SPX above its 61.8 Fib retracement (SPX 4320).


twitter
opader@gmail.com


SPX: S&P 500 Index    SMA: Simple Moving Average
DJI: Dow Jones Industrial Index    EMA: Exponential Moving Average
DJT: Dow Jones Transportation Index    PDL: Primary Downtrend Line
NAZ: NASDAQ Composite Index    PUL: Primary Uptrend Line
RUT: Russell 2000 Index    ASL: Active Support Line
OEX: S&P 100 Index    ARL: Active Resistance Line
NDX: NASDAQ 100 Index    DTL: Dynamic Trend Line   
TUL: Tentative Uptrend Line   TDL: Tentative Downtrend Line
TLR: Trend Line Resistance   TLS: Trend Line Support

Disclaimer: The views expressed are provided for informational purposes only and should not be construed in any way as investment advice or recommendation.  Furthermore, the opinions expressed may change without notice.