Monday, December 26, 2022

A Roller Coaster Ride To Nowhere

SGS Market Timer Status:  SHORT 
SHORT as of the close of Friday December 9, 2022
Previous SGS Status
SGS is a Long-Term (weeks to months) Timer
Why Market Timing Is A Must


The US Economy is growing at a healthy rate of 3.2% with a historic low level of unemployment (The Push).  At the same time, the Federal Reserve is aggressively raising rates and reducing its balance sheet (The Pull).  This Push and Pull is the reason why major indices have been on a roller coater ride to nowhere for the last few month.  The ride to nowhere very likely continues for a while, maybe a long while.


SGS Market Timer

As of the close of last Friday (12/23), the value of SGS was calculated to be -335 and the status of SGS remains SHORT.


S&P 500 Support And Resistance Levels

Support and resistance levels for SPX for this week are shown above.  No change since last week, at this point there is a reasonable chance that SPX tests the support that exist around its October low (
3500).  Should that support fail, then SPX would sell further to test 3200 level which is also 61.8% Fib. retracement level of the Covid  rally (2191 to all-time high 4818).


My Plan

I am planning to continue to stay in cash and open new positions sometime in the first week of 2023.  

Merry Christmas & Happy New Year


twitter
opader@gmail.com


SPX: S&P 500 Index    SMA: Simple Moving Average
DJI: Dow Jones Industrial Index    EMA: Exponential Moving Average
DJT: Dow Jones Transportation Index    PDL: Primary Downtrend Line
NAZ: NASDAQ Composite Index    PUL: Primary Uptrend Line
RUT: Russell 2000 Index    ASL: Active Support Line
OEX: S&P 100 Index    ARL: Active Resistance Line
NDX: NASDAQ 100 Index    DTL: Dynamic Trend Line   
TUL: Tentative Uptrend Line   TDL: Tentative Downtrend Line
TLR: Trend Line Resistance   TLS: Trend Line Support

Disclaimer: The views expressed are provided for informational purposes only and should not be construed in any way as investment advice or recommendation.  Furthermore, the opinions expressed may change without notice. 

Sunday, December 18, 2022

Going Sideways Is More Likely

SGS Market Timer Status:  SHORT 
SHORT as of the close of Friday December 9, 2022
Previous SGS Status
SGS is a Long-Term (weeks to months) Timer
Why Market Timing Is A Must


SGS Market Timer

As of the close of last Friday (12/16), the value of SGS was calculated to be -482 and the status of SGS remains SHORT.


S&P 500 Support And Resistance Levels

Support and resistance levels for SPX for this week are shown above.  No change since last week, at this point there is a reasonable chance that SPX tests the support that exist around its October low (
3500).  Should that support fail, then SPX would sell further to test 3200 level which is also 61.8% Fib. retracement level of the Covid  rally (2191 to all-time high 4818).


My Plan

I continued to stay in cash last week.  My plan is to see what indices do early this week and if selling continues, open a new position in SDS.


twitter
opader@gmail.com


SPX: S&P 500 Index    SMA: Simple Moving Average
DJI: Dow Jones Industrial Index    EMA: Exponential Moving Average
DJT: Dow Jones Transportation Index    PDL: Primary Downtrend Line
NAZ: NASDAQ Composite Index    PUL: Primary Uptrend Line
RUT: Russell 2000 Index    ASL: Active Support Line
OEX: S&P 100 Index    ARL: Active Resistance Line
NDX: NASDAQ 100 Index    DTL: Dynamic Trend Line   
TUL: Tentative Uptrend Line   TDL: Tentative Downtrend Line
TLR: Trend Line Resistance   TLS: Trend Line Support

Disclaimer: The views expressed are provided for informational purposes only and should not be construed in any way as investment advice or recommendation.  Furthermore, the opinions expressed may change without notice.    

Sunday, December 11, 2022

October Low Is Very Likely Tested

SGS Market Timer Status:  SHORT 
SHORT as of the close of Friday December 9, 2022
Previous SGS Status
SGS is a Long-Term (weeks to months) Timer
Why Market Timing Is A Must


SGS Market Timer

As of the close of last Friday (12/9), the value of SGS was calculated to be -215 and the status of SGS changed from NEUTRAL to SHORT.


S&P 500 Support And Resistance Levels

Support and resistance levels for SPX for this week are shown above.  At this point there is a reasonable chance that SPX tests the support that exist around its October low (
3500).  Should that support fail, then SPX would sell further to test 3200 level which is also 61.8% Fib. retracement level of the Covid  rally (2191 to all-time high 4818).


My Plan

With SGS being SHORT now, my plan is open a new position in SDS sometime this week.


twitter
opader@gmail.com


SPX: S&P 500 Index    SMA: Simple Moving Average
DJI: Dow Jones Industrial Index    EMA: Exponential Moving Average
DJT: Dow Jones Transportation Index    PDL: Primary Downtrend Line
NAZ: NASDAQ Composite Index    PUL: Primary Uptrend Line
RUT: Russell 2000 Index    ASL: Active Support Line
OEX: S&P 100 Index    ARL: Active Resistance Line
NDX: NASDAQ 100 Index    DTL: Dynamic Trend Line   
TUL: Tentative Uptrend Line   TDL: Tentative Downtrend Line
TLR: Trend Line Resistance   TLS: Trend Line Support

Disclaimer: The views expressed are provided for informational purposes only and should not be construed in any way as investment advice or recommendation.  Furthermore, the opinions expressed may change without notice.   
Sunday, December 4, 2022

SPX Is Up Against Strong Resistance

SGS  Market Timer Status:  NEUTRAL 
NEUTRAL as of the close of Friday November 25, 2022
Previous SGS Status
SGS is a Long-Term (weeks to months) Timer
Why Market Timing Is A Must


SGS Market Timer

As of the close of last Friday (12/2), the value of SGS was calculated to be +17 and the status of SGS remains NEUTRAL.


S&P 500 Support And Resistance Levels

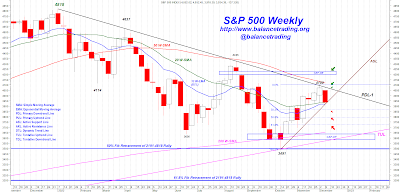
Support and resistance levels for SPX for this week are shown above.  SPX 4100-4300 is going to act as a strong resistance range and I expect SPX to trade within that range for a week or two.  Should SPX clears 4300, then there would be a good chance for SPX rallies to challenge its all-time high. 


My Plan

I am 95% in cash and planning to wait to see if the status of SGS changes on this Friday.


twitter
opader@gmail.com


SPX: S&P 500 Index    SMA: Simple Moving Average
DJI: Dow Jones Industrial Index    EMA: Exponential Moving Average
DJT: Dow Jones Transportation Index    PDL: Primary Downtrend Line
NAZ: NASDAQ Composite Index    PUL: Primary Uptrend Line
RUT: Russell 2000 Index    ASL: Active Support Line
OEX: S&P 100 Index    ARL: Active Resistance Line
NDX: NASDAQ 100 Index    DTL: Dynamic Trend Line   
TUL: Tentative Uptrend Line   TDL: Tentative Downtrend Line

Disclaimer: The views expressed are provided for informational purposes only and should not be construed in any way as investment advice or recommendation.  Furthermore, the opinions expressed may change without notice. 

Sunday, November 27, 2022

SGS Market Timer Is Neutral

SGS  Market Timer Status:  NEUTRAL 
NEUTRAL as of the close of Friday November 25, 2022
Previous SGS Status
SGS is a Long-Term (weeks to months) Timer
Why Market Timing Is A Must


SGS Market Timer

As of the close of last Friday (11/25), the value of SGS was calculated to be -5 and the status of SGS changed from SHORT to NEUTRAL.


S&P 500 Support And Resistance Levels

Support and resistance levels for SPX for this week are shown above.  There is a good chance at this point for SPX to continue to rally to test its PDL-1.


My Plan

I am 95% in cash and planning to wait to see if the status of SGS changes on this Friday.


twitter
opader@gmail.com


SPX: S&P 500 Index    SMA: Simple Moving Average
DJI: Dow Jones Industrial Index    EMA: Exponential Moving Average
DJT: Dow Jones Transportation Index    PDL: Primary Downtrend Line
NAZ: NASDAQ Composite Index    PUL: Primary Uptrend Line
RUT: Russell 2000 Index    ASL: Active Support Line
OEX: S&P 100 Index    ARL: Active Resistance Line
NDX: NASDAQ 100 Index    DTL: Dynamic Trend Line   
TUL: Tentative Uptrend Line   TDL: Tentative Downtrend Line

Disclaimer: The views expressed are provided for informational purposes only and should not be construed in any way as investment advice or recommendation.  Furthermore, the opinions expressed may change without notice.  

Sunday, November 20, 2022

SPX Is On A Razor Edge

SGS  Market Timer Status:  SHORT 
SHORT as of the close of Friday November 4, 2022
Previous SGS Status
SGS is a Long-Term (weeks to months) Timer
Why Market Timing Is A Must


SGS Market Timer

As of the close of last Friday (11/18), the value of SGS was calculated to be -111 and the status of SGS remains SHORT.


S&P 500 Support And Resistance Levels

Support and resistance levels for SPX for this week are shown above.  SPX is on a razor edge and could tilt substantially higher or lower.  A breach of ASL would signal more selling to test TUL and SPX 3500.  A beach of ARL would signal further advance to test PDL-1 around SPX 4100 and 61.8% Fib. retracement around SPX 4300.


My Plan

I am 95% in cash and planning to wait to see what SPX does this week.


twitter
opader@gmail.com


SPX: S&P 500 Index    SMA: Simple Moving Average
DJI: Dow Jones Industrial Index    EMA: Exponential Moving Average
DJT: Dow Jones Transportation Index    PDL: Primary Downtrend Line
NAZ: NASDAQ Composite Index    PUL: Primary Uptrend Line
RUT: Russell 2000 Index    ASL: Active Support Line
OEX: S&P 100 Index    ARL: Active Resistance Line
NDX: NASDAQ 100 Index    DTL: Dynamic Trend Line   
TUL: Tentative Uptrend Line   TDL: Tentative Downtrend Line

Disclaimer: The views expressed are provided for informational purposes only and should not be construed in any way as investment advice or recommendation.  Furthermore, the opinions expressed may change without notice.  

Sunday, November 13, 2022

Rally Continues

SGS  Market Timer Status:  SHORT 
SHORT as of the close of Friday November 4, 2022
Previous SGS Status
SGS is a Long-Term (weeks to months) Timer
Why Market Timing Is A Must


SGS Market Timer

As of the close of last Friday (11/11), the value of SGS was calculated to be -60 and the status of SGS remains SHORT.

S&P 500 Support And Resistance Levels

Support and resistance levels for SPX for this week are shown above.  At this point there is a good chance that SPX rallies this week to test PDL-1.


My Plan

I am 95% in cash (I have 5% in crypto unfortunately) and planning to wait to see what SPX does this week.


twitter
opader@gmail.com


SPX: S&P 500 Index    SMA: Simple Moving Average
DJI: Dow Jones Industrial Index    EMA: Exponential Moving Average
DJT: Dow Jones Transportation Index    PDL: Primary Downtrend Line
NAZ: NASDAQ Composite Index    PUL: Primary Uptrend Line
RUT: Russell 2000 Index    ASL: Active Support Line
OEX: S&P 100 Index    ARL: Active Resistance Line
NDX: NASDAQ 100 Index    DTL: Dynamic Trend Line   
TUL: Tentative Uptrend Line   TDL: Tentative Downtrend Line

Disclaimer: The views expressed are provided for informational purposes only and should not be construed in any way as investment advice or recommendation.  Furthermore, the opinions expressed may change without notice. 

Saturday, November 5, 2022

SGS Market Timer Is SHORT Again

SGS  Market Timer Status:  SHORT 
SHORT as of the close of Friday November 4, 2022
Previous SGS Status
SGS is a Long-Term (weeks to months) Timer
Why Market Timing Is A Must


SGS Market Timer

As of the close of last Friday (11/4), the value of SGS was calculated to be -401 and the status of SGS changed from NEUTRAL to SHORT.


S&P 500 Support And Resistance Levels

Support and resistance levels for SPX for this week are shown above.  If the mid-term election ends up in another shit-show, then there would be a good chance that SPX sells off to test its October lows.  A weekly close below 3500 (50% Fib) would signal a test of SPX 3200 (61.8% Fib).


My Plan

I am 95% in cash and planning to wait to see if SPX closes below 3500 sometime this week before opening new short positions via SDS. 


twitter
opader@gmail.com


SPX: S&P 500 Index    SMA: Simple Moving Average
DJI: Dow Jones Industrial Index    EMA: Exponential Moving Average
DJT: Dow Jones Transportation Index    PDL: Primary Downtrend Line
NAZ: NASDAQ Composite Index    PUL: Primary Uptrend Line
RUT: Russell 2000 Index    ASL: Active Support Line
OEX: S&P 100 Index    ARL: Active Resistance Line
NDX: NASDAQ 100 Index    DTL: Dynamic Trend Line   
TUL: Tentative Uptrend Line   TDL: Tentative Downtrend Line

Disclaimer: The views expressed are provided for informational purposes only and should not be construed in any way as investment advice or recommendation.  Furthermore, the opinions expressed may change without notice.   

Saturday, October 29, 2022

SGS Market Timer Is Neutral

SGS  Market Timer Status:  NEUTRAL 
NEUTRAL as of the close of Friday October 28, 2022
Previous SGS Status
SGS is a Long-Term (weeks to months) Timer
Why Market Timing Is A Must


SGS Market Timer

As of the close of last Friday (10/28), the value of SGS was calculated to be -49 and the status of SGS changed from SHORT to NEUTRAL.


S&P 500 Support And Resistance Levels

Support and resistance levels for SPX for this week are shown above.  There is a good chance at this point for SPX to continue to rally to test its PDL-1.


My Plan

I am 95% in cash and planning to wait to see if the status of SGS changes on Friday.


twitter
opader@gmail.com


SPX: S&P 500 Index    SMA: Simple Moving Average
DJI: Dow Jones Industrial Index    EMA: Exponential Moving Average
DJT: Dow Jones Transportation Index    PDL: Primary Downtrend Line
NAZ: NASDAQ Composite Index    PUL: Primary Uptrend Line
RUT: Russell 2000 Index    ASL: Active Support Line
OEX: S&P 100 Index    ARL: Active Resistance Line
NDX: NASDAQ 100 Index    DTL: Dynamic Trend Line   
TUL: Tentative Uptrend Line   TDL: Tentative Downtrend Line

Disclaimer: The views expressed are provided for informational purposes only and should not be construed in any way as investment advice or recommendation.  Furthermore, the opinions expressed may change without notice.  

Sunday, October 23, 2022

No Change In Macro Picture, Still Very Bearish

SGS  Market Timer Status:  SHORT 
SHORT as of the close of Friday August 19, 2022
Previous SGS Status
SGS is a Long-Term (weeks to months) Timer
Why Market Timing Is A Must


SGS Market Timer

As of the close of last Friday (10/21), the value of SGS was calculated to be -805 and the status of SGS remains SHORT.


S&P 500 Support And Resistance Levels

Support and resistance levels for SPX for this week are shown above.  There is no change in the macro picture, the Fed raising rates, QT on at $95 Billion per month, and inflation raging.  Should SPX breaches its critical support at 3500, a move to 3200 is likely in the next few weeks.


My Plan

Should SPX close below 3500, my plan is to open new SDS positions. 


twitter
opader@gmail.com


SPX: S&P 500 Index    SMA: Simple Moving Average
DJI: Dow Jones Industrial Index    EMA: Exponential Moving Average
DJT: Dow Jones Transportation Index    PDL: Primary Downtrend Line
NAZ: NASDAQ Composite Index    PUL: Primary Uptrend Line
RUT: Russell 2000 Index    ASL: Active Support Line
OEX: S&P 100 Index    ARL: Active Resistance Line
NDX: NASDAQ 100 Index    DTL: Dynamic Trend Line   
TUL: Tentative Uptrend Line   TDL: Tentative Downtrend Line

Disclaimer: The views expressed are provided for informational purposes only and should not be construed in any way as investment advice or recommendation.  Furthermore, the opinions expressed may change without notice.  

Sunday, October 16, 2022

SPX 3500 Is A Critical Support

SGS  Market Timer Status:  SHORT 
SHORT as of the close of Friday August 19, 2022
Previous SGS Status
SGS is a Long-Term (weeks to months) Timer
Why Market Timing Is A Must


SGS Market Timer

As of the close of last Friday (10/14), the value of SGS was calculated to be -853 and the status of SGS remains SHORT.


S&P 500 Support And Resistance Levels

Support and resistance levels for SPX for this week are shown above.  Should SPX breaches its critical support at 3500, a move to 3200 is likely in the next few weeks.


twitter
opader@gmail.com


SPX: S&P 500 Index    SMA: Simple Moving Average
DJI: Dow Jones Industrial Index    EMA: Exponential Moving Average
DJT: Dow Jones Transportation Index    PDL: Primary Downtrend Line
NAZ: NASDAQ Composite Index    PUL: Primary Uptrend Line
RUT: Russell 2000 Index    ASL: Active Support Line
OEX: S&P 100 Index    ARL: Active Resistance Line
NDX: NASDAQ 100 Index    DTL: Dynamic Trend Line   
TUL: Tentative Uptrend Line   TDL: Tentative Downtrend Line

Disclaimer: The views expressed are provided for informational purposes only and should not be construed in any way as investment advice or recommendation.  Furthermore, the opinions expressed may change without notice.  

Sunday, October 9, 2022

Another Run At SPX 3500 Is Likely This Week

SGS  Market Timer Status:  SHORT 
SHORT as of the close of Friday August 19, 2022
Previous SGS Status
SGS is a Long-Term (weeks to months) Timer
Why Market Timing Is A Must


SGS Market Timer

As of the close of last Friday (10/7), the value of SGS was calculated to be --585 and the status of SGS remains SHORT.


S&P 500 Support And Resistance Levels

Support and resistance levels for SPX for this week are shown above.  Again, there is a good chance that SPX gives up between 50% to 60% of its gain from its Covid low (2191) to its ATH (4818).  That puts SPX somewhere between 3500 (another 4% loss from Friday close) to 3200 (another 12% loss from Friday close) when this correction is done.

This week I expect SPX to test 3500.  There is a good chance that we see a sizable counter-trend rally back to ARL around 3800-3900 before selling resumes again.


My Plan

I closed 50% of my SDS position last Friday.   My plan is to close my remaining SDS position if and when SPX reaches 3500.  SDS should be trading around 56.65 if that happens. 


twitter
opader@gmail.com


SPX: S&P 500 Index    SMA: Simple Moving Average
DJI: Dow Jones Industrial Index    EMA: Exponential Moving Average
DJT: Dow Jones Transportation Index    PDL: Primary Downtrend Line
NAZ: NASDAQ Composite Index    PUL: Primary Uptrend Line
RUT: Russell 2000 Index    ASL: Active Support Line
OEX: S&P 100 Index    ARL: Active Resistance Line
NDX: NASDAQ 100 Index    DTL: Dynamic Trend Line   
TUL: Tentative Uptrend Line   TDL: Tentative Downtrend Line

Disclaimer: The views expressed are provided for informational purposes only and should not be construed in any way as investment advice or recommendation.  Furthermore, the opinions expressed may change without notice.