Sunday, April 24, 2022

Short-term, Indices Are Oversold

SGS  Market Timer Status:  SHORT 
SHORT as of the close of Friday April 8, 2022
Previous SGS Status
SGS is a Long-Term (weeks to months) Timer
Why Market Timing Is A Must


SGS Market Timer

As of the close of last Friday (4/22), the value of SGS was calculated to be --1180 and the status of SGS remains SHORT. 


S&P 500 Support And Resistance Levels

Support and resistance levels for SPX for this week are shown above.  Indices are over-sold short-term (hours to days) and there is a good chance that we see a sizable bounce early this week.  Medium-term (days to weeks), I have no idea where things are heading as emotional choppiness continues.  Longer-term (weeks to months), a buying opportunity is coming up soon.


My Plan

With SGS being SHORT, my plan is to stay in cash.


twitter
opader@gmail.com


SPX: S&P 500 Index    SMA: Simple Moving Average
DJI: Dow Jones Industrial Index    EMA: Exponential Moving Average
DJT: Dow Jones Transportation Index    PDL: Primary Downtrend Line
NAZ: NASDAQ Composite Index    PUL: Primary Uptrend Line
RUT: Russell 2000 Index    ASL: Active Support Line
OEX: S&P 100 Index    ARL: Active Resistance Line
NDX: NASDAQ 100 Index    DTL: Dynamic Trend Line   
TUL: Tentative Uptrend Line   TDL: Tentative Downtrend Line
TLR: Trend Line Resistance   TLS: Trend Line Support

Disclaimer: The views expressed are provided for informational purposes only and should not be construed in any way as investment advice or recommendation.  Furthermore, the opinions expressed may change without notice. 

Sunday, April 17, 2022

Selling Is Very Likely Done This Week

SGS  Market Timer Status:  SHORT 
SHORT as of the close of Friday April 8, 2022
Previous SGS Status
SGS is a Long-Term (weeks to months) Timer
Why Market Timing Is A Must


SGS Market Timer

As of the close of last Thursday (4/14), the value of SGS was calculated to be -382 and the status of SGS remains SHORT. 


S&P 500 Support And Resistance Levels

Support and resistance levels for SPX for this week are shown above.  There is a good chance that SPX sell early this week and find a bottom or the bottom around 4350-4330.


My Plan

SGS changed its status to SHORT last Friday and the value SGS decreased everyday last week.  I closed my long position on Monday last week.  My plan is to stay in cash.


twitter
opader@gmail.com


SPX: S&P 500 Index    SMA: Simple Moving Average
DJI: Dow Jones Industrial Index    EMA: Exponential Moving Average
DJT: Dow Jones Transportation Index    PDL: Primary Downtrend Line
NAZ: NASDAQ Composite Index    PUL: Primary Uptrend Line
RUT: Russell 2000 Index    ASL: Active Support Line
OEX: S&P 100 Index    ARL: Active Resistance Line
NDX: NASDAQ 100 Index    DTL: Dynamic Trend Line   
TUL: Tentative Uptrend Line   TDL: Tentative Downtrend Line
TLR: Trend Line Resistance   TLS: Trend Line Support

Disclaimer: The views expressed are provided for informational purposes only and should not be construed in any way as investment advice or recommendation.  Furthermore, the opinions expressed may change without notice. 

Sunday, April 10, 2022

SGS Market Timer Is SHORT

SGS  Market Timer Status:  SHORT 
SHORT as of the close of Friday April 8, 2022
Previous SGS Status
SGS is a Long-Term (weeks to months) Timer
Why Market Timing Is A Must


SGS Market Timer

As of the close of last Friday (4/8), the value of SGS was calculated to be -343 and the status of SGS changed from NEUTRAL to SHORT. 


S&P 500 Support And Resistance Levels


Support and resistance levels for SPX for this week are shown above.


My Plan

Last Wednesday I expected SGS to go LONG by Friday last week.  I put in 35% of my cash into SPY.  I'm planning to stay with that position for now.


twitter
opader@gmail.com


SPX: S&P 500 Index    SMA: Simple Moving Average
DJI: Dow Jones Industrial Index    EMA: Exponential Moving Average
DJT: Dow Jones Transportation Index    PDL: Primary Downtrend Line
NAZ: NASDAQ Composite Index    PUL: Primary Uptrend Line
RUT: Russell 2000 Index    ASL: Active Support Line
OEX: S&P 100 Index    ARL: Active Resistance Line
NDX: NASDAQ 100 Index    DTL: Dynamic Trend Line   
TUL: Tentative Uptrend Line   TDL: Tentative Downtrend Line
TLR: Trend Line Resistance   TLS: Trend Line Support

Disclaimer: The views expressed are provided for informational purposes only and should not be construed in any way as investment advice or recommendation.  Furthermore, the opinions expressed may change without notice. 

Sunday, April 3, 2022

SGS Market Timer Is NEUTRAL

SGS  Market Timer Status:  NEUTRAL 
NEUTRAL as of the close of Friday April 1, 2022
Previous SGS Status
SGS is a Long-Term (weeks to months) Timer
Why Market Timing Is A Must


SGS Market Timer

As of the close of last Friday (4/1), the value of SGS was calculated to be -37 and the status of SGS changed from SHORT to NEUTRAL. 


S&P 500 Support And Resistance Levels


Support and resistance levels for SPX for this week are shown above.


My Plan

Last Wednesday I expected SGS to go LONG by Friday last week.  I put in 35% of my cash into SPY.  I'm planning to stay with that position for now.


twitter
opader@gmail.com


SPX: S&P 500 Index    SMA: Simple Moving Average
DJI: Dow Jones Industrial Index    EMA: Exponential Moving Average
DJT: Dow Jones Transportation Index    PDL: Primary Downtrend Line
NAZ: NASDAQ Composite Index    PUL: Primary Uptrend Line
RUT: Russell 2000 Index    ASL: Active Support Line
OEX: S&P 100 Index    ARL: Active Resistance Line
NDX: NASDAQ 100 Index    DTL: Dynamic Trend Line   
TUL: Tentative Uptrend Line   TDL: Tentative Downtrend Line
TLR: Trend Line Resistance   TLS: Trend Line Support

Disclaimer: The views expressed are provided for informational purposes only and should not be construed in any way as investment advice or recommendation.  Furthermore, the opinions expressed may change without notice.    
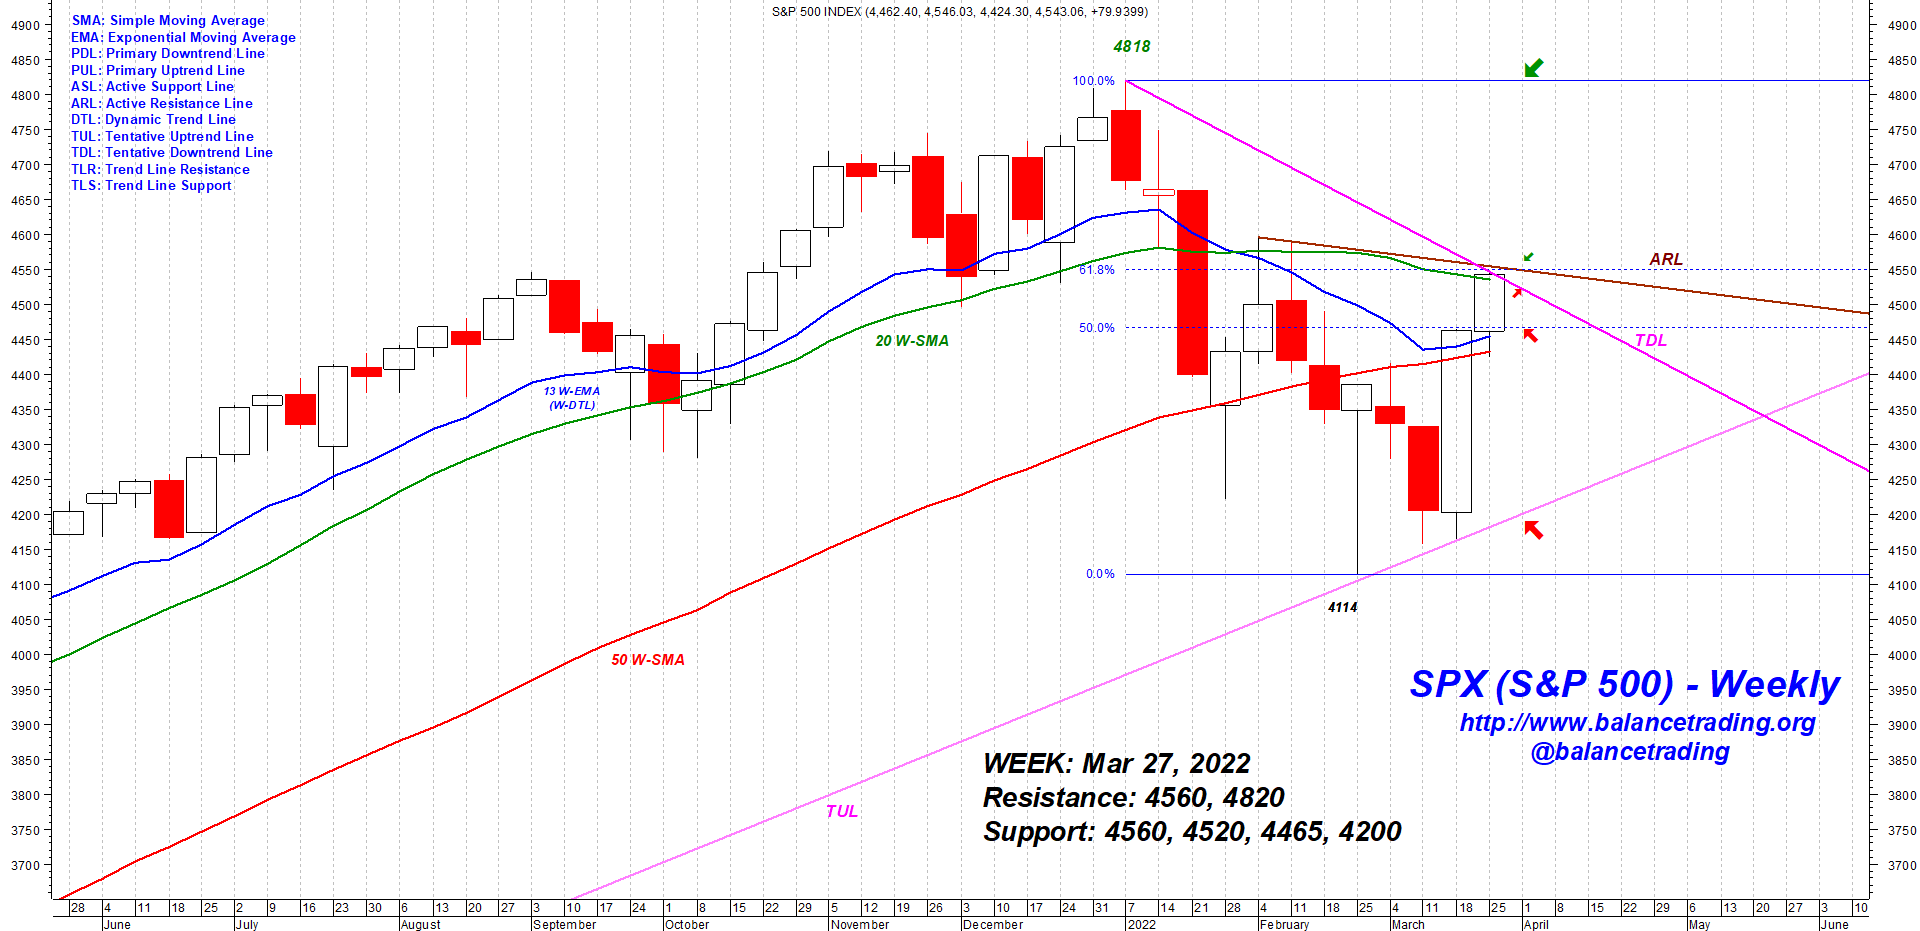
Sunday, March 27, 2022

SGS Market Timer Is SHORT

SGS  Market Timer Status:  SHORT 
SHORT as of the close of Friday March 25, 2022
Previous SGS Status
SGS is a Long-Term (weeks to months) Timer
Why Market Timing Is A Must


SGS Market Timer

As of the close of last Friday (3/25), the value of SGS was calculated to be -138 and the status of SGS changed from NEUTRAL to SHORT.  That is a disappointing number for bulls.  It indicates that indices are pushed higher via big caps while the broader market having a hard time catching up.  I think there is a good chance that we see a small sell-off next week before heading higher. 


S&P 500 Support And Resistance Levels

Support and resistance levels for SPX for this week are shown above.


My Plan

The value of SGS didn't go above +50 last week.  I am 95% in cash and watching from the sideline.


twitter
opader@gmail.com


SPX: S&P 500 Index    SMA: Simple Moving Average
DJI: Dow Jones Industrial Index    EMA: Exponential Moving Average
DJT: Dow Jones Transportation Index    PDL: Primary Downtrend Line
NAZ: NASDAQ Composite Index    PUL: Primary Uptrend Line
RUT: Russell 2000 Index    ASL: Active Support Line
OEX: S&P 100 Index    ARL: Active Resistance Line
NDX: NASDAQ 100 Index    DTL: Dynamic Trend Line   
TUL: Tentative Uptrend Line   TDL: Tentative Downtrend Line
TLR: Trend Line Resistance   TLS: Trend Line Support

Disclaimer: The views expressed are provided for informational purposes only and should not be construed in any way as investment advice or recommendation.  Furthermore, the opinions expressed may change without notice.   

Sunday, March 20, 2022

SGS Market Timer Is NEUTRAL

SGS  Market Timer Status:  NEUTRAL 
NEUTRAL as of the close of Friday March 18, 2022
Previous SGS Status
SGS is a Long-Term (weeks to months) Timer
Why Market Timing Is A Must


SGS Market Timer

As of the close of last Friday (3/18), the value of SGS was calculated to be -15 and the status of SGS changed from SHORT to NEUTERAL


S&P 500 Support And Resistance Levels

Support and resistance levels for SPX for this week are shown above.


My Plan

My plan is to watch SGS and if its daily calculated value goes higher than +50, I would open long positions.


twitter
opader@gmail.com


SPX: S&P 500 Index    SMA: Simple Moving Average
DJI: Dow Jones Industrial Index    EMA: Exponential Moving Average
DJT: Dow Jones Transportation Index    PDL: Primary Downtrend Line
NAZ: NASDAQ Composite Index    PUL: Primary Uptrend Line
RUT: Russell 2000 Index    ASL: Active Support Line
OEX: S&P 100 Index    ARL: Active Resistance Line
NDX: NASDAQ 100 Index    DTL: Dynamic Trend Line   
TUL: Tentative Uptrend Line   TDL: Tentative Downtrend Line
TLR: Trend Line Resistance   TLS: Trend Line Support

Disclaimer: The views expressed are provided for informational purposes only and should not be construed in any way as investment advice or recommendation.  Furthermore, the opinions expressed may change without notice.  

Sunday, March 13, 2022

Selling Continues

SGS  Market Timer Status:  SHORT 
SHORT as of the close of Friday January 7, 2022
Previous SGS Status
SGS is a Long-Term (weeks to months) Timer
Why Market Timing Is A Must


SGS Market Timer

As of the close of last Friday (3/11), the value of SGS was calculated to be -858 and the status of SGS remains SHORT.  


S&P 500 Support And Resistance Levels

Support and resistance levels for SPX for this week are shown above.


My Plan

Per my plan I closed my long positions last Tuesday.  Looking to open short positions sometime this week.


twitter
opader@gmail.com


SPX: S&P 500 Index    SMA: Simple Moving Average
DJI: Dow Jones Industrial Index    EMA: Exponential Moving Average
DJT: Dow Jones Transportation Index    PDL: Primary Downtrend Line
NAZ: NASDAQ Composite Index    PUL: Primary Uptrend Line
RUT: Russell 2000 Index    ASL: Active Support Line
OEX: S&P 100 Index    ARL: Active Resistance Line
NDX: NASDAQ 100 Index    DTL: Dynamic Trend Line   
TUL: Tentative Uptrend Line   TDL: Tentative Downtrend Line
TLR: Trend Line Resistance   TLS: Trend Line Support

Disclaimer: The views expressed are provided for informational purposes only and should not be construed in any way as investment advice or recommendation.  Furthermore, the opinions expressed may change without notice. 

Sunday, March 6, 2022

Ukraine / Russia Situation Is Getting Serious

SGS  Market Timer Status:  SHORT 
SHORT as of the close of Friday January 7, 2022
Previous SGS Status
SGS is a Long-Term (weeks to months) Timer
Why Market Timing Is A Must


Both Russia and the West are issuing new threats.  Hopefully this would not end in a direct conflict between NATO and Russian forces. 


SGS Market Timer

As of the close of last Friday (3/4), the value of SGS was calculated to be -741 and the status of SGS remains SHORT.  


S&P 500 Support And Resistance Levels

Support and resistance levels for SPX for this week are shown above.


My Plan

I am watching SPX 4222.  A close below that would signal significant selling ahead.  My plan is to close my long position should SPX closes below 4222.


twitter
opader@gmail.com


SPX: S&P 500 Index    SMA: Simple Moving Average
DJI: Dow Jones Industrial Index    EMA: Exponential Moving Average
DJT: Dow Jones Transportation Index    PDL: Primary Downtrend Line
NAZ: NASDAQ Composite Index    PUL: Primary Uptrend Line
RUT: Russell 2000 Index    ASL: Active Support Line
OEX: S&P 100 Index    ARL: Active Resistance Line
NDX: NASDAQ 100 Index    DTL: Dynamic Trend Line   
TUL: Tentative Uptrend Line   TDL: Tentative Downtrend Line
TLR: Trend Line Resistance   TLS: Trend Line Support

Disclaimer: The views expressed are provided for informational purposes only and should not be construed in any way as investment advice or recommendation.  Furthermore, the opinions expressed may change without notice.  

Sunday, February 27, 2022

Correction Is Very Likely Over

SGS  Market Timer Status:  SHORT 
SHORT as of the close of Friday January 7, 2022
Previous SGS Status
SGS is a Long-Term (weeks to months) Timer
Why Market Timing Is A Must


There is a good chance that the recent correction has run its course and indices are on their way to new all-time highs and beyond.


SGS Market Timer

As of the close of last Friday (2/25), the value of SGS was calculated to be --182 and the status of SGS remains SHORT.  


S&P 500 Support And Resistance Levels

Support and resistance levels for SPX for this week are shown above.


My Plan

Last Thursday I moved 20% of my cash into SPY and IWM.  My plan is to move my remaining cash into SPY and IWM sometime this week.


twitter
opader@gmail.com


SPX: S&P 500 Index    SMA: Simple Moving Average
DJI: Dow Jones Industrial Index    EMA: Exponential Moving Average
DJT: Dow Jones Transportation Index    PDL: Primary Downtrend Line
NAZ: NASDAQ Composite Index    PUL: Primary Uptrend Line
RUT: Russell 2000 Index    ASL: Active Support Line
OEX: S&P 100 Index    ARL: Active Resistance Line
NDX: NASDAQ 100 Index    DTL: Dynamic Trend Line   
TUL: Tentative Uptrend Line   TDL: Tentative Downtrend Line
TLR: Trend Line Resistance   TLS: Trend Line Support

Disclaimer: The views expressed are provided for informational purposes only and should not be construed in any way as investment advice or recommendation.  Furthermore, the opinions expressed may change without notice.  

Sunday, February 20, 2022

Putin's Big Bluff

SGS  Market Timer Status:  SHORT 
SHORT as of the close of Friday January 7, 2022
Previous SGS Status
SGS is a Long-Term (weeks to months) Timer
Why Market Timing Is A Must


I am not a Russian or Ukrainian expert but it seems to me that Putin is bluffing about going into Ukraine and the West has called his bluff.  So now he has three options: (1) fold and back off, (2) invade, or (3) do little incursions here and there (Donbas region) but keep full invasion option on the table.  I think Putin very likely does the third option and the standoff continues for a while.  If Putin actually invades, indices would take a leg down and SPX could drop another 5% to around 4000.   


SGS Market Timer

As of the close of last Friday (2/18), the value of SGS was calculated to be -645 and the status of SGS remains SHORT.  


S&P 500 Support And Resistance Levels

Support and resistance levels for SPX for this week are shown above.


My Plan

For now, I am planning to stay with my long positions.


twitter
opader@gmail.com


SPX: S&P 500 Index    SMA: Simple Moving Average
DJI: Dow Jones Industrial Index    EMA: Exponential Moving Average
DJT: Dow Jones Transportation Index    PDL: Primary Downtrend Line
NAZ: NASDAQ Composite Index    PUL: Primary Uptrend Line
RUT: Russell 2000 Index    ASL: Active Support Line
OEX: S&P 100 Index    ARL: Active Resistance Line
NDX: NASDAQ 100 Index    DTL: Dynamic Trend Line   
TUL: Tentative Uptrend Line   TDL: Tentative Downtrend Line
TLR: Trend Line Resistance   TLS: Trend Line Support

Disclaimer: The views expressed are provided for informational purposes only and should not be construed in any way as investment advice or recommendation.  Furthermore, the opinions expressed may change without notice.  

Sunday, February 13, 2022

No Change Since Last Week

SGS  Market Timer Status:  SHORT 
SHORT as of the close of Friday January 7, 2022
Previous SGS Status
SGS is a Long-Term (weeks to months) Timer
Why Market Timing Is A Must


SGS Market Timer

As of the close of last Friday (2/11), the value of SGS was calculated to be -733 and the status of SGS remains SHORT.  Improvement in the value of SGS since SPX 4222 low signals a high likelihood of continuation of the recent rally.


S&P 500 Support And Resistance Levels


Support and resistance levels for SPX for this week are shown above.  The price improvement since SPX 4222 low, confirmed by various indicators including SGS, signals a high likelihood of continuation of the rally to a new all-time high and beyond. 


My Plan

Last week I opened in a new long position in IWM on Wednesday and a new position in SPY on Friday in anticipation of SGS changing its status from SHORT to NEUTRAL or LONG on Friday.  That didn't not happen but there is a good chance that would happen next Friday.


twitter
opader@gmail.com


SPX: S&P 500 Index    SMA: Simple Moving Average
DJI: Dow Jones Industrial Index    EMA: Exponential Moving Average
DJT: Dow Jones Transportation Index    PDL: Primary Downtrend Line
NAZ: NASDAQ Composite Index    PUL: Primary Uptrend Line
RUT: Russell 2000 Index    ASL: Active Support Line
OEX: S&P 100 Index    ARL: Active Resistance Line
NDX: NASDAQ 100 Index    DTL: Dynamic Trend Line   
TUL: Tentative Uptrend Line   TDL: Tentative Downtrend Line
TLR: Trend Line Resistance   TLS: Trend Line Support

Disclaimer: The views expressed are provided for informational purposes only and should not be construed in any way as investment advice or recommendation.  Furthermore, the opinions expressed may change without notice. 

Sunday, February 6, 2022

A New Bull Leg Very Likely Has Started

SGS  Market Timer Status:  SHORT 
SHORT as of the close of Friday January 7, 2022
Previous SGS Status
SGS is a Long-Term (weeks to months) Timer
Why Market Timing Is A Must


SGS Market Timer

As of the close of last Friday (2/4), the value of SGS was calculated to be -618 and the status of SGS remains SHORT.  Improvement in the value of SGS since SPX 4222 low signals a high likelihood of continuation of the recent rally.


S&P 500 Support And Resistance Levels

Support and resistance levels for SPX for this week are shown above.  The price improvement since SPX 4222 low, confirmed by various indicators including SGS, signals a high likelihood of continuation of the rally to a new all-time high and beyond. 


My Plan

I opened in a new long position in SPY last Thursday in anticipation of SGS changing its status from SHORT to NEUTRAL or LONG on Friday.  That didn't not happen but there is a good chance that would happen next Friday.


twitter
opader@gmail.com


SPX: S&P 500 Index    SMA: Simple Moving Average
DJI: Dow Jones Industrial Index    EMA: Exponential Moving Average
DJT: Dow Jones Transportation Index    PDL: Primary Downtrend Line
NAZ: NASDAQ Composite Index    PUL: Primary Uptrend Line
RUT: Russell 2000 Index    ASL: Active Support Line
OEX: S&P 100 Index    ARL: Active Resistance Line
NDX: NASDAQ 100 Index    DTL: Dynamic Trend Line   
TUL: Tentative Uptrend Line   TDL: Tentative Downtrend Line
TLR: Trend Line Resistance   TLS: Trend Line Support

Disclaimer: The views expressed are provided for informational purposes only and should not be construed in any way as investment advice or recommendation.  Furthermore, the opinions expressed may change without notice