SGS Market Timer Status: SHORT
SHORT as of the close of Friday November 19, 2021
Previous SGS Status
SGS is a Long-Term (weeks to months) Timer
Why Market Timing Is A Must
SGS Market Timer
As of the close of last Friday (12/17), the value of SGS was calculated to be -550 and the status of SGS remains SHORT.
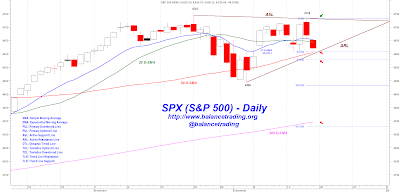
S&P 500 Support And Resistance Levels

My Plan
I'm in cash except for two small crypto positions. Should SPX close below its 50 D-SMA on its daily chart, I would open new positions in SPXS, TZA, and SQQQ (10% of total capital each).
SPX: S&P 500 Index SMA: Simple Moving Average
DJI: Dow Jones Industrial Index EMA: Exponential Moving Average
DJT: Dow Jones Transportation Index PDL: Primary Downtrend Line
NAZ: NASDAQ Composite Index PUL: Primary Uptrend Line
RUT: Russell 2000 Index ASL: Active Support Line
OEX: S&P 100 Index ARL: Active Resistance Line
NDX: NASDAQ 100 Index DTL: Dynamic Trend Line
TUL: Tentative Uptrend Line TDL: Tentative Downtrend Line
TLR: Trend Line Resistance TLS: Trend Line Support
Disclaimer: The views expressed are provided for informational purposes only and should not be construed in any way as investment advice or recommendation. Furthermore, the opinions expressed may change without notice.

