SGS Market Timer Status: SHORT
SHORT as of the close of Friday January 7, 2022
Previous SGS Status
SGS is a Long-Term (weeks to months) Timer
Why Market Timing Is A Must
Starting last week, companies have been reporting their 2021 fourth quarter earnings and their forecast for 2022. How Market reacts to those reports will set the direction and the pace for major indices. This week NFLX and GS report; next week AAPL, TSLA, LRCX, MSFT, and MA report.
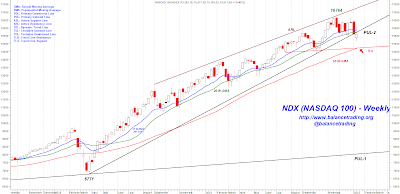
As shown on the chart above, NDX sold off two weeks ago but found support at it PUL-2 which had been shouldering its gains since late March 2020. Last week, NDX opened substantially below its PUL-2 on Monday and recovered most of its losses but still closed below its PUL-2 for the week. There is a good chance that selling resumes this week and NDX drops to test TLS and its 50 W-SMA around 14,750.
SGS Market Timer
As of the close of last Friday (1/14), the value of SGS was calculated to be -790 and the status of SGS remains SHORT.
S&P 500 Support And Resistance Levels

Support and resistance levels for SPX for this week are shown above. Last Monday SPX sold off and found support at its PUL-2 and closed above it for the week. Should selling resume in SPX this week, there would be a good chance SPX drops below its PUL-2, tests its TLS and 50 W-SMA around 4400.
My Plan
Per my plan last Monday I opened a position in SPXS but later in the week as SGS value improved I closed my position. I'm in cash except for two small crypto positions. I am watching earnings report by NFLX and GS this week. With SGS being SHORT, my plan is to open new positions in SPXS, TZA, and SQQQ (10% of total capital each) sometime this week,
SPX: S&P 500 Index SMA: Simple Moving Average
DJI: Dow Jones Industrial Index EMA: Exponential Moving Average
DJT: Dow Jones Transportation Index PDL: Primary Downtrend Line
NAZ: NASDAQ Composite Index PUL: Primary Uptrend Line
RUT: Russell 2000 Index ASL: Active Support Line
OEX: S&P 100 Index ARL: Active Resistance Line
NDX: NASDAQ 100 Index DTL: Dynamic Trend Line
TUL: Tentative Uptrend Line TDL: Tentative Downtrend Line
TLR: Trend Line Resistance TLS: Trend Line Support
Disclaimer: The views expressed are provided for informational purposes only and should not be construed in any way as investment advice or recommendation. Furthermore, the opinions expressed may change without notice.

