SGS Market Timer Status: SHORT
SHORT as of the close of Friday April 8, 2022
Previous SGS Status
SGS is a Long-Term (weeks to months) Timer
Why Market Timing Is A Must
Generally speaking, in a bull market, sell-offs are sizable but short-lived with no follow through. In a bear market, rallies are sizable but short-lived and with no follow through. The rally last Friday looked to be nothing but a typical bear market rally. It was sizable but we have to see if it has any follow through early next week.
Friday's late day short-covering rally was due to what James Bullard said on Fox Business regarding economic growth for the rest of this year and next. He expressed a very bullish outlook for the economy and employment. He was expecting the US economy to grow at 3% or higher and he saw no chance of recession this year or next despite aggressive rate hikes by the Fed. Of course someone like Bullard, a super hawk, has to talk like that to justify his super aggressive stand against inflation.
Friday's late day short-covering rally was due to what James Bullard said on Fox Business regarding economic growth for the rest of this year and next. He expressed a very bullish outlook for the economy and employment. He was expecting the US economy to grow at 3% or higher and he saw no chance of recession this year or next despite aggressive rate hikes by the Fed. Of course someone like Bullard, a super hawk, has to talk like that to justify his super aggressive stand against inflation.
If the Fed goes through with their QT plan (around $50 Billion in June, $50 Billion in July, and $100 Billion per month starting in August) while raising rates, they would run both the stock market and the economy into the ground. Something has to give soon and my bet is that the Fed will stop its aggressive QT. Otherwise, the entire financial system would start to come apart once losses in SPX exceeds 30%.
SGS Market Timer
As of the close of last Friday (5/20), the value of SGS was calculated to be -926 and the status of SGS remains SHORT.
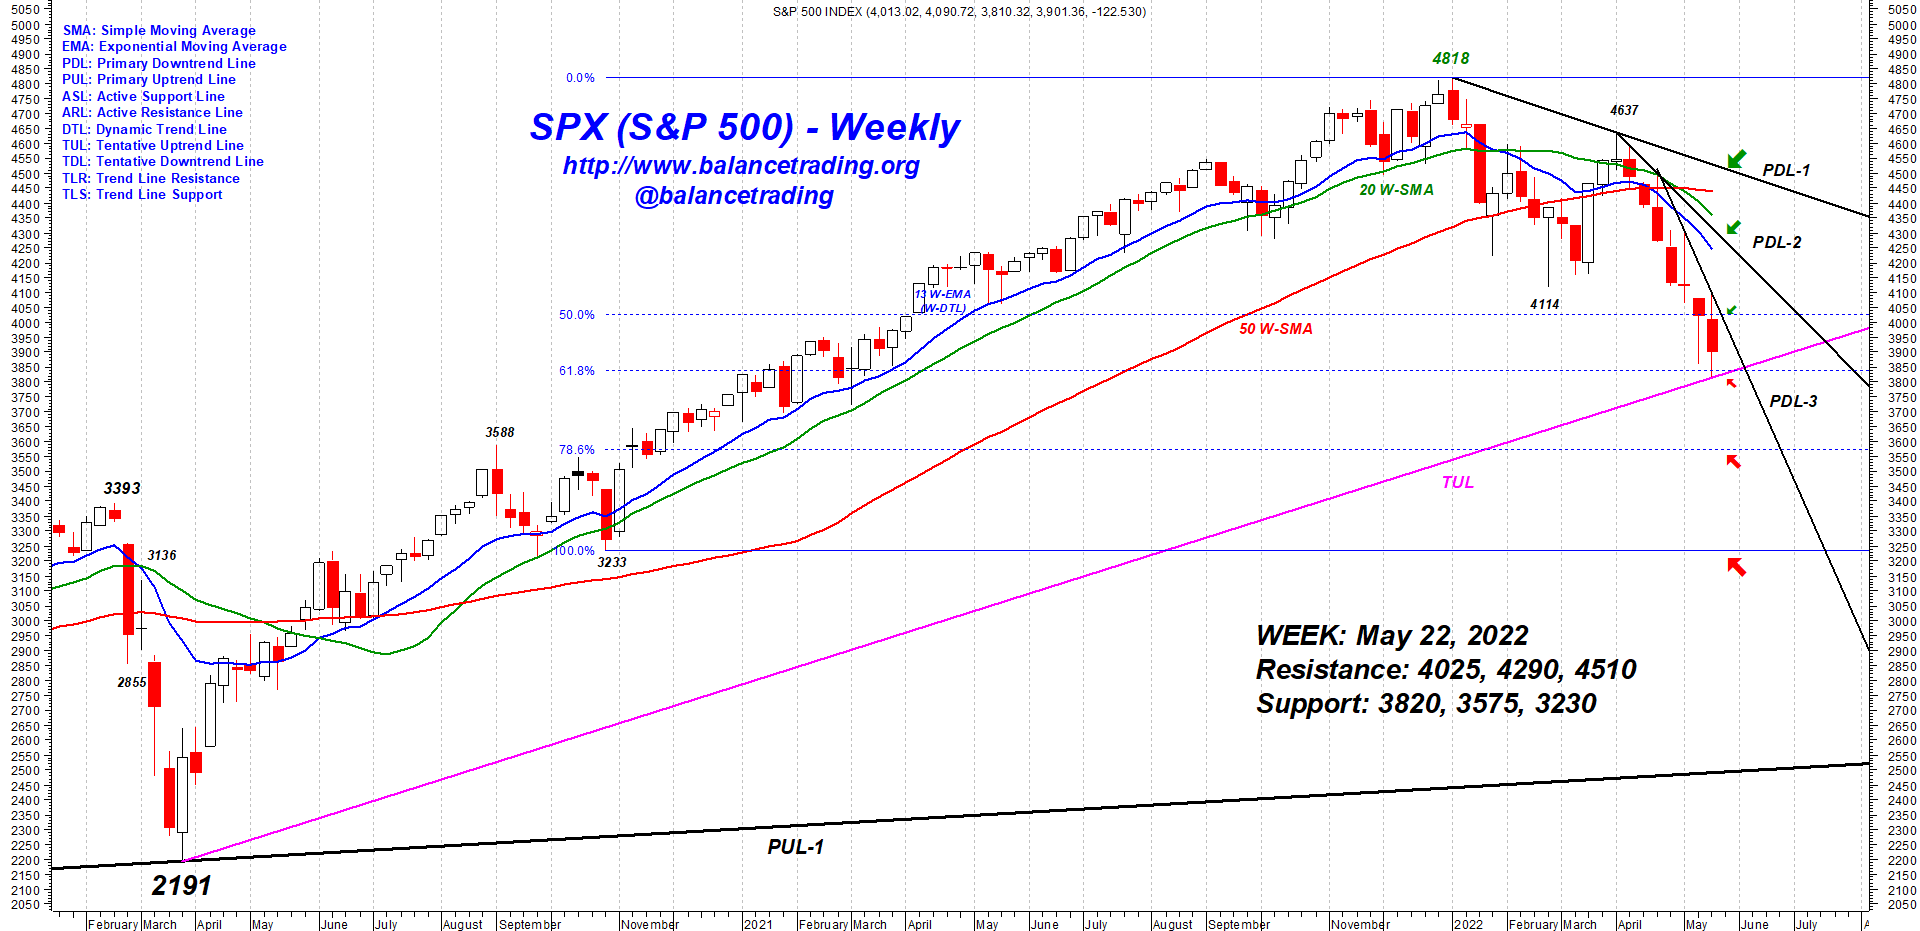
S&P 500 Support And Resistance Levels
My Plan
SPX: S&P 500 Index SMA: Simple Moving Average
DJI: Dow Jones Industrial Index EMA: Exponential Moving Average
DJT: Dow Jones Transportation Index PDL: Primary Downtrend Line
NAZ: NASDAQ Composite Index PUL: Primary Uptrend Line
RUT: Russell 2000 Index ASL: Active Support Line
OEX: S&P 100 Index ARL: Active Resistance Line
NDX: NASDAQ 100 Index DTL: Dynamic Trend Line
TUL: Tentative Uptrend Line TDL: Tentative Downtrend Line
TLR: Trend Line Resistance TLS: Trend Line Support
Disclaimer: The views expressed are provided for informational purposes only and should not be construed in any way as investment advice or recommendation. Furthermore, the opinions expressed may change without notice.

